· Dayo Adetoye (PhD, C|CISO) · Partnering with the Business · 7 min read
Plan Disruption Probability (PDP):
A CISO’s Guide to Linking Cyber Risk to Business Strategy.
Cybersecurity isn’t just about stopping attacks - it’s about safeguarding the company’s ability to execute its long-range financial plan. Enter Plan Disruption Probability (PDP), a metric that quantifies the likelihood of cyber-induced losses materially derailing financial targets. By measuring PDP, organizations can proactively manage risk within appetite and ensure business resilience.
As a CISO, it’s critical to recognize that your CFO and CEO are focused on executing the company’s long-range financial plan (LRP), and they are acutely aware of risks that could derail it. Among these is a material cyber event, which is not just a security incident but a disruption that can directly impact the company’s ability to meet its financial targets. To align cybersecurity with business strategy, CISOs must effectively assess, communicate, and manage this risk within the organization’s appetite.
Why Plan Disruption Probability Matters
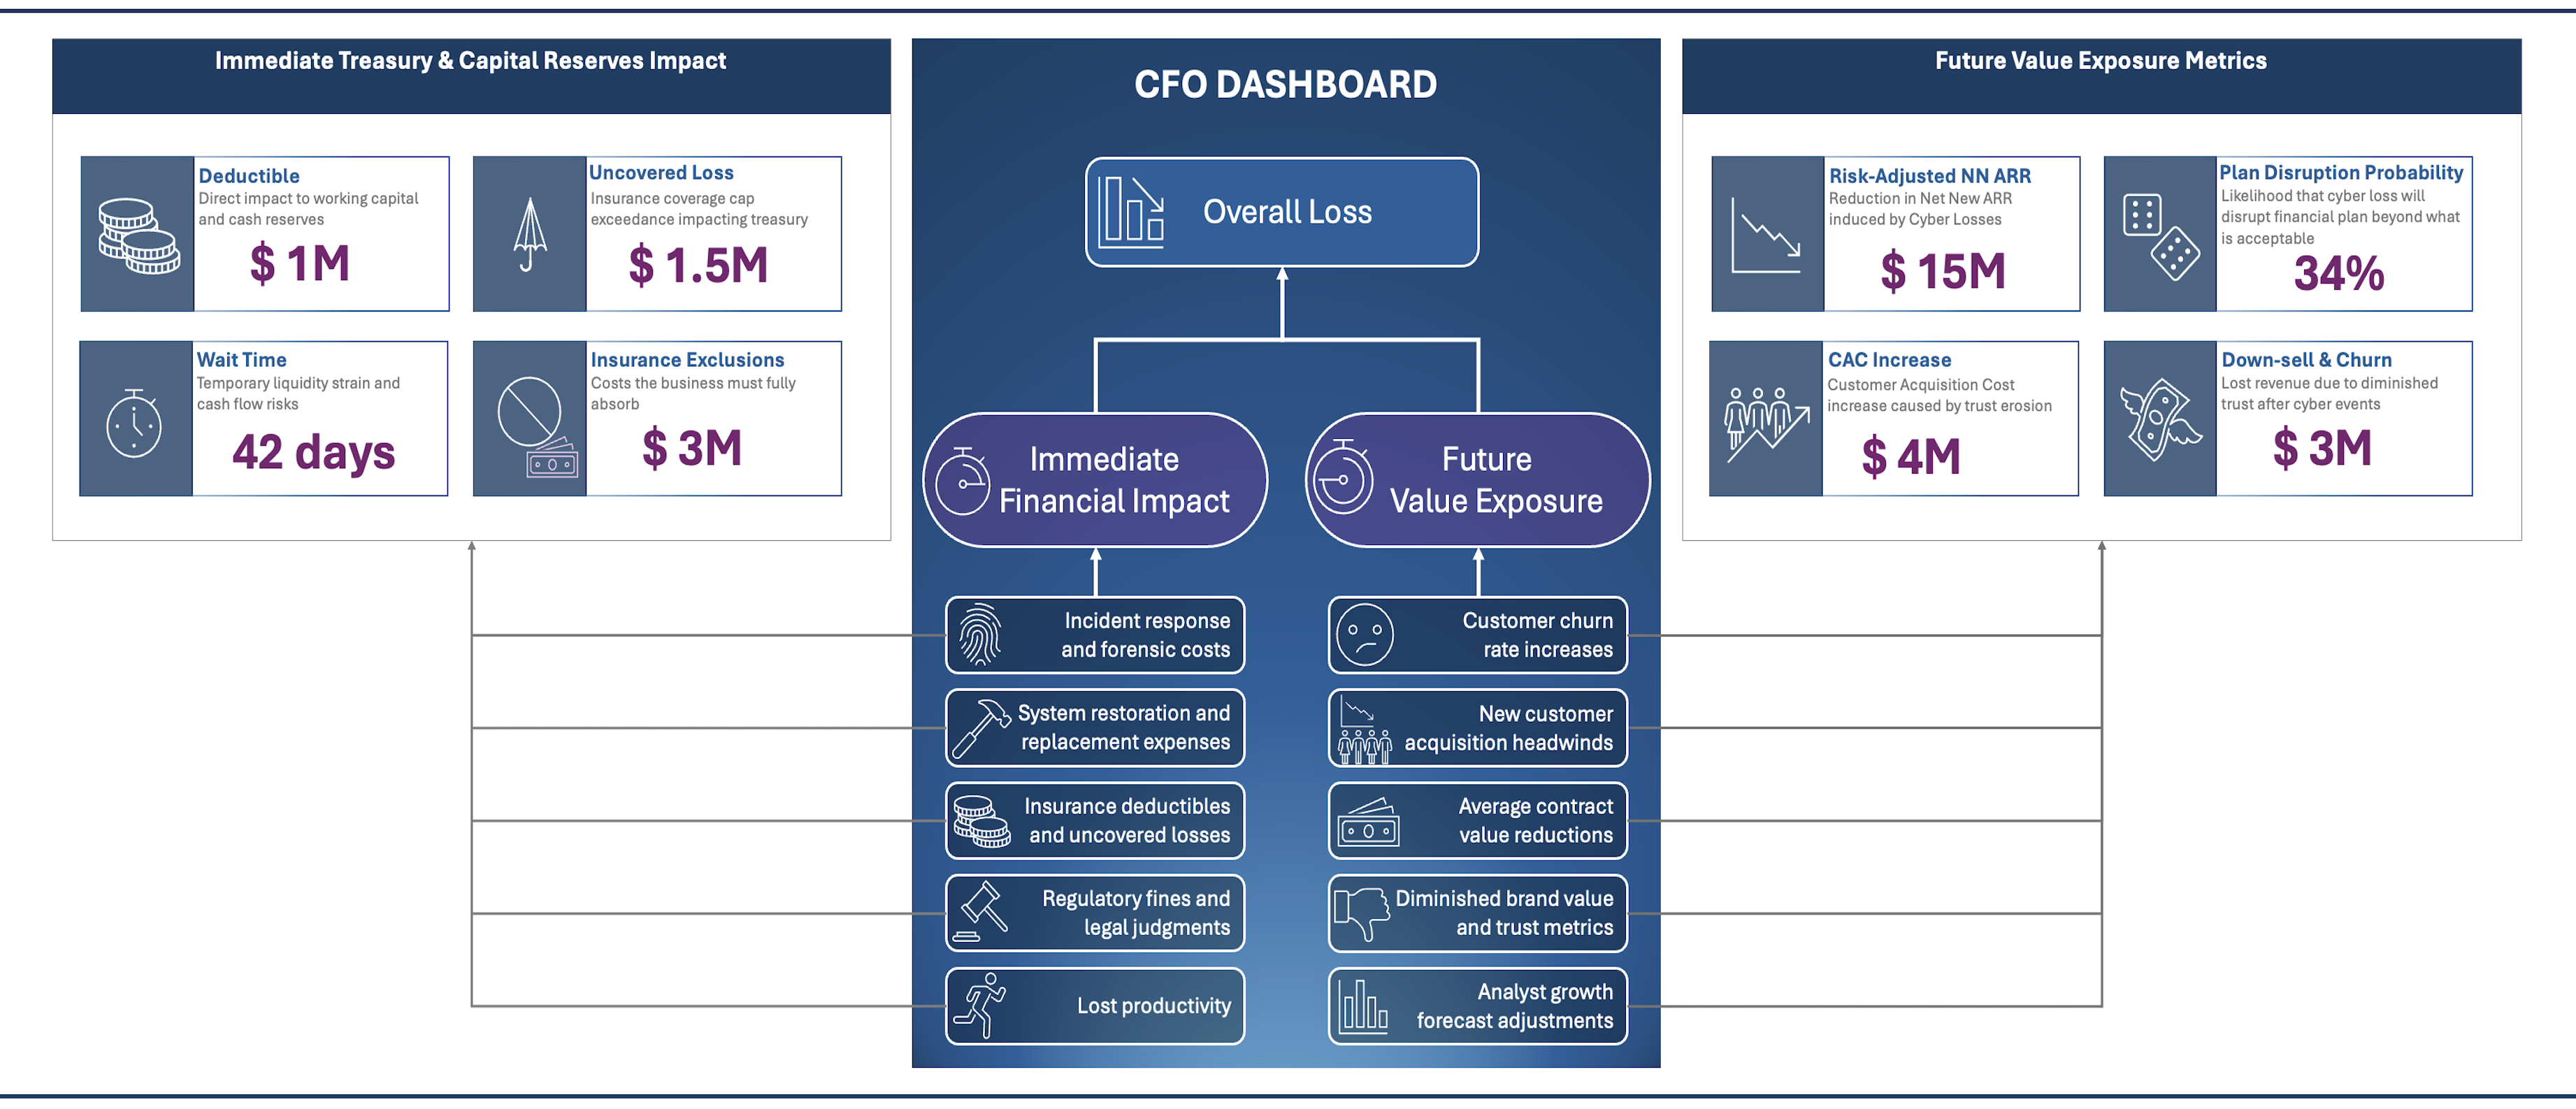
Cyber risk isn’t just an IT problem, it is a business problem with direct financial consequences. Yet, cybersecurity is often discussed in technical terms that don’t translate to executive decision-making. Boards, CFOs, and CEOs don’t just want to know if the organization is secure; they want to understand how cyber risks could impact financial performance.
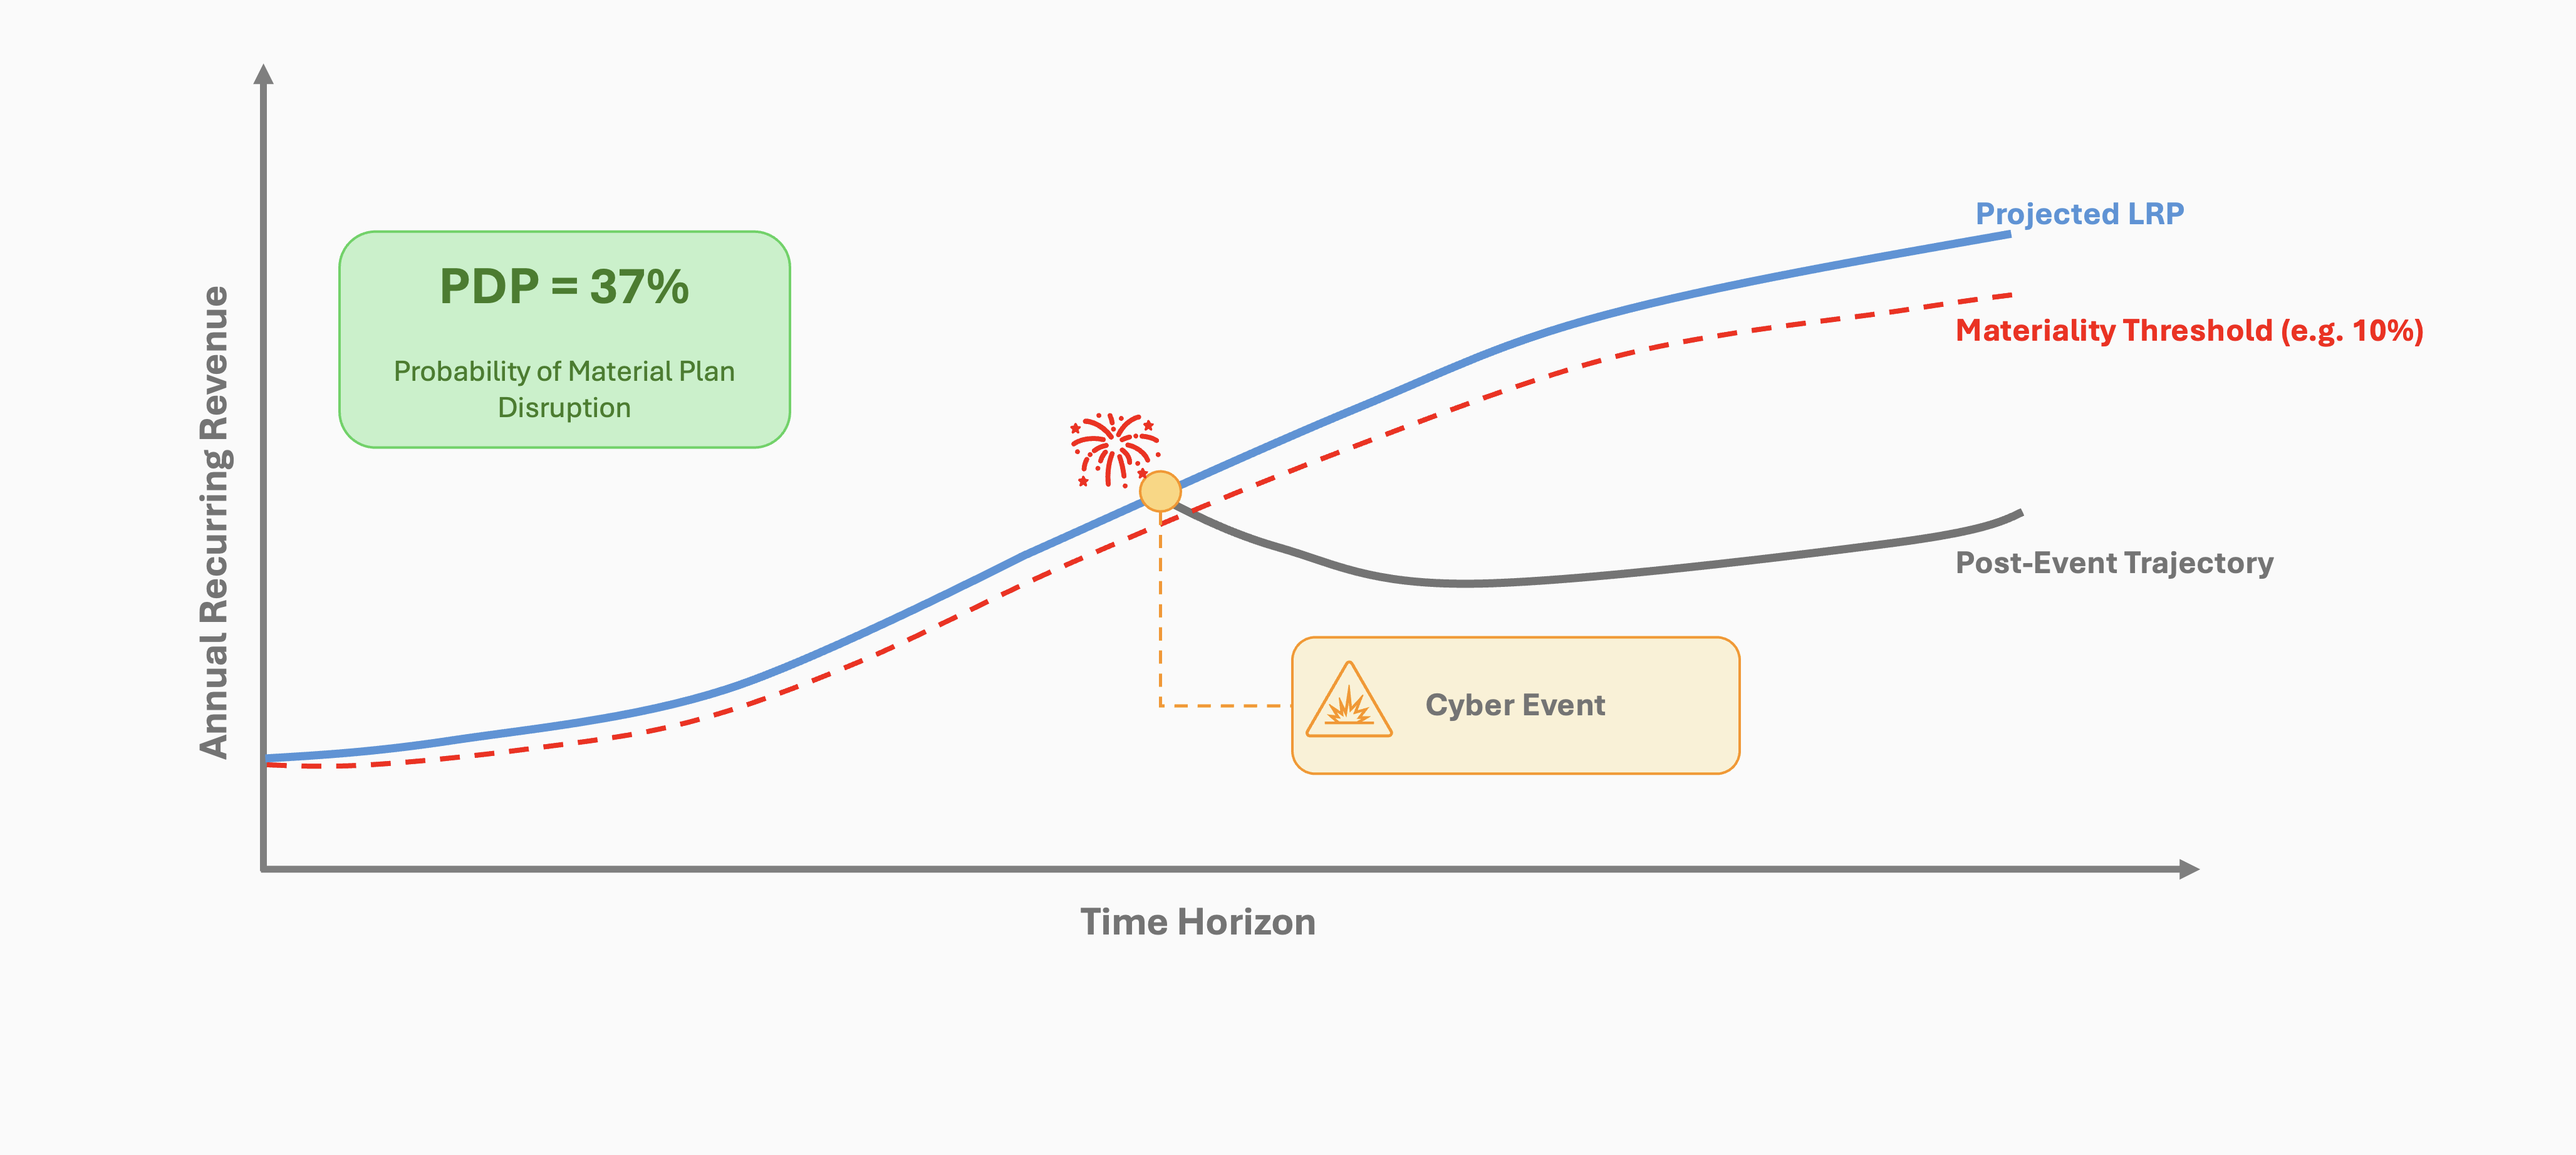
This is where Plan Disruption Probability (PDP) comes in. PDP is a board-ready, decision-grade metric that quantifies the likelihood that cyber-induced losses will exceed a materiality threshold, such as a 5% drop in Net New ARR or a missed EBITDA target. Instead of vague risk statements or theoretical threats, PDP provides a concrete, probability-driven measure of financial risk, helping business leaders make informed decisions.
By framing cyber risk in terms of its impact on the company’s long-range financial plan, PDP enables:
- Better alignment with business priorities: CISOs can shift from talking about threats to discussing financial resilience.
- Stronger risk-based decision-making: Investments in security can be weighed against their impact on reducing PDP.
- Clearer communication with leadership: Executives gain an actionable, quantifiable way to understand cyber risk in their own terms.
In short, PDP shifts the conversation from cybersecurity as a cost center to cybersecurity as a strategic enabler of financial resilience. It directly connects cyber risk to financial planning and risk appetite.
Beyond the Financial Plan: A Versatile Risk Lens
While this article focuses on the long-range financial plan as a proxy for the business goal, the PDP framework is highly adaptable. The same logic can be applied to any strategic, quantifiable objective - such as IPO readiness, product delivery timelines, market expansion, brand and reputation impact, or operational uptime - where disruption from cyber risk matters.
Want to see it in action? Jump to the PDP Calculator below.
Applying PDP to Strategic Risk Decisions

So how can you use PDP as a CISO?
Here are some practical ways to integrate it into strategic decisions:
🎯 Board Reporting: Report PDP alongside other board-level security metrics to show how cyber risks threaten the company’s ability to meet financial targets.
💸 Budget Justification: Demonstrate how specific investments - such as segmentation, email filtering, or cyber insurance - reduce PDP, translating technical proposals into financial ROI.
🧩 Scenario Planning: Model PDP under different assumptions (e.g., changes in threat landscape or resilience posture) to inform strategic planning or tabletop exercises.
🧭 Risk Appetite Alignment: Collaborate with finance leaders to define what level of disruption risk is acceptable. Is a 10% PDP tolerable? Or should it be below 5%?
By using PDP, CISOs gain a shared language with business leadership - grounding risk decisions in measurable impact on strategic and financial outcomes.
PDP Calculator
Use the interactive calculator below to estimate Plan Disruption Probability.
Plan Disruption Probability Tolerance Threshold: 5%
LRP Exceedance Probability Risk-Adjusted LRP
Loss Exceedance Probability
For a detailed explanation of how the model works, including its inputs, assumptions, and outputs, expand the section below.
🎯 Purpose
The model estimates how cyber losses could derail a company’s Long-Range Plan (LRP) - for example, Net New ARR or EBITDA.
It produces a single, forward-looking metric: Plan Disruption Probability (PDP) - the likelihood that projected performance falls below a disruption threshold.
🔑 Key Inputs & Why They Matter
1. Cyber Loss Model
- Type: Log-Normal Distribution
- Inputs:
- SME-estimated average annual loss
- 1% tail loss (severe but plausible event)
- Why: Cyber loss is heavy-tailed - rare events can cause outsized financial impact. This model reflects that asymmetry.
2. Impact Sensitivity Curve
- Type: Normal Distribution (per percentile)
- Inputs:
- SME-provided LRP reduction estimates at the 5th, 50th, and 99th percentiles of cyber loss
- Plus uncertainty range for each
- Why: Business impact isn’t linear — small losses may be absorbed, large ones may trigger outsized consequences. This curve captures that nuance with uncertainty baked in.
3. LRP Baseline Projection
- Type: Log-Normal Distribution
- Inputs:
- CFO-provided Low, Medium, and High LRP (e.g. Net New ARR) estimates
- Why: Business growth is multiplicative, not additive (e.g., compounding YoY). This model reflects that reality and accommodates upside/downside scenarios.
4. Disruption Tolerance Threshold
- Type: Percentage-based rule
- Inputs:
- Acceptable drop from LRP (e.g., 5% below projection)
- Why: Financial tolerance isn’t absolute—it should scale with the size of the plan. This approach adapts thresholds to each simulation.
5. Likelihood of Loss Event
- Type: Scalar probability (0% –100%)
- Inputs:
- Estimated annual probability of a cyber loss event occurring (e.g., 30%)
- Why: Not every year has a major event. Incorporating likelihood yields more realistic forecasts by simulating the chance of any loss occurring.
🔁 Simulation Workflow (Simplified)
Sample Cyber Loss
- Draw a loss amount from the log-normal cyber loss distribution (if loss event occurs).
Map to Impact
- Use the sampled loss to find its percentile (e.g., 95th)
- Use the corresponding sensitivity curve to sample a % reduction in LRP
Sample Baseline LRP
- Draw a projected LRP from the CFO log-normal forecast
Apply Impact
- Multiply baseline LRP by (1 - impact %) → Risk-adjusted LRP
Check Disruption
- Compare to the scenario-specific disruption threshold
- If below threshold and a loss occurred → mark as disrupted
Repeat
- Run thousands (10,000 in the calculator) of iterations to calculate the Plan Disruption Probability (PDP)
- PDP is adjusted by the likelihood of loss event (e.g., if likelihood = 30%, and 20% of scenarios disrupt, final PDP = 0.3 * 0.2 = 6%)
📈 Key Outputs & How to Use Them
| Output | What it Tells You | Use Case |
|---|---|---|
| Simulated LRP Distribution | Financial performance with cyber risk baked in | Scenario planning, stress testing |
| Plan Disruption Probability (PDP) | Chance of falling below acceptable target | Risk appetite setting, investment prioritization |
| PDP Exceedance Curve | Disruption likelihood across thresholds | Helps define “acceptable risk” |
🧠 Why This Matters
This model bridges security and strategy.
It connects technical risks to business outcomes—giving CISOs, CFOs, and CEOs a shared language to evaluate and manage cyber risk as a strategic business driver.
Conclusion
Cybersecurity leaders today must do more than protect systems - they must protect the company’s ability to grow. Plan Disruption Probability (PDP) reframes cyber risk in terms of strategic business outcomes, allowing CISOs to quantify how likely it is that cyber losses will derail the company’s long-range plan.
By expressing cyber risk in financial terms, PDP enables stronger alignment with the CFO, more informed board-level discussions, and smarter decisions around risk mitigation and investment. It transforms cyber risk from an abstract threat into a measurable, actionable business issue.
An additional strength of this approach is that the model is Bayesian update–ready - as new data becomes available (e.g., incidents, threat trends, impact assessments), the model can be calibrated iteratively to reflect the organization’s evolving risk landscape. This makes PDP not just a static snapshot, but a living, learning metric.
Future Areas of Improvement
As with any model, PDP estimation can be refined and matured over time. Some areas to focus on include:
Improved Data Calibration: One of the most common challenges you’ll face is skepticism around SME-provided loss impact estimates. While expert judgment is valuable, integrating historical loss data and industry benchmarks can significantly enhance the credibility and precision of the model. In the absence of robust data, leveraging structured inputs from multiple SMEs - with calibration techniques to account for individual biases - can improve reliability and support defensible decision-making.
Bayesian Updating with Real-Time Signals: Integrating Bayesian methods allows the model to be continuously refined with new evidence - improving precision and responsiveness to emerging risks.
Operational Feedback Loops: Connecting PDP to leading indicators (e.g., control maturity, incident rates) enables proactive risk forecasting.
Integration with Enterprise Risk Platforms: Embedding PDP within ERM or FP&A workflows helps unify risk management across functions.
Scenario Stress Testing: Tailoring simulations to specific threat scenarios (e.g., ransomware, insider risk, geopolitical instability) can guide strategic preparation and response.
Model Validation & Confidence Quantification: Enhancing confidence interval interpretation and validating SME assumptions will build greater trust and transparency at the executive level.
As cyber threats continue to evolve, so must the way we measure and manage them. PDP offers a foundation for evidence-based, business-aligned cyber risk governance - with the flexibility to adapt, learn, and stay relevant in a dynamic environment.